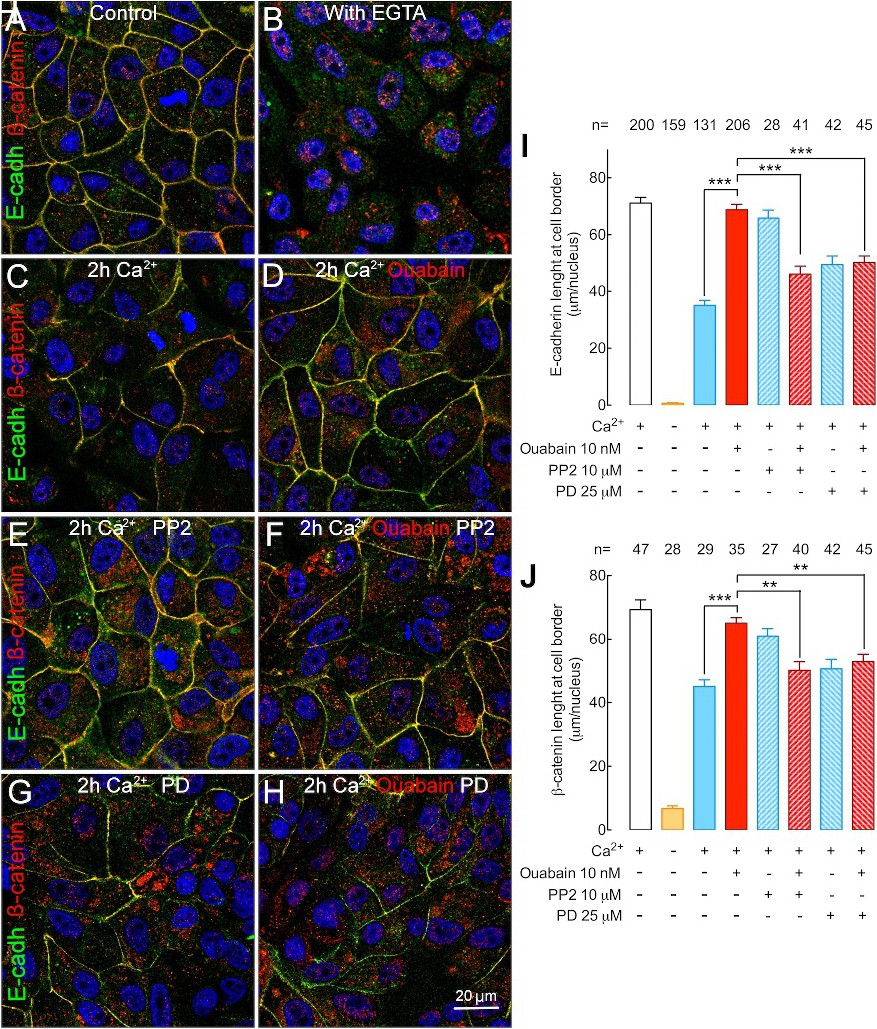
Fig. 6. Ouabain accelerates adherens junction formation in a c-Src and ERK1/2 independent manner. (A) Distribution of E-cadherin (green) and β-catenin (red) in control cells. (B) Cells without calcium for 2 h. (C and D) Cells that remained without calcium for 2 h, and at that moment, were switched to Ca2+ containing medium for an additional 2 h in the absence (C) and in the presence (D) of ouabain. (E) corresponds to cells switched to Ca2+ in the presence of PP2. (F) Cells switched to Ca2+ in the presence of PP2 and ouabain. (G) corresponds to cells switched to Ca2+ in the presence of PD, and (H) corresponds to cells exposed to Ca2+, PD and ouabain. The images show the total projection of 40 to 60 optical slices. Statistical analysis of the linear fluorescent signal of (I) E-cadherin and (J) β-catenin at the cell borders during Ca2+ removal and replenishment in the absence or presence of the c-Src or ERK1/2 inhibitors. The white bar corresponds to the control cells, the yellow bar corresponds to the cells incubated for 2 h with EGTA, the blue bars correspond to cells switched to Ca2+, the red bars correspond to cells switched to Ca2+ in the presence of ouabain, the slashed bars indicate cells incubated with PP2 and the back-slashed bars indicate cells incubated with PD. The n represents the number of cells from 3 to 7 independent experiments analyzed by one-way ANOVA with Bonferroni's selected pairs comparison.